
Paste a link. See exactly where the price has been.
Drop any e-commerce link and get full price history in seconds. No account. No friction. Just the chart.


Ranked by real buying velocity
These products spiked in purchase activity in the last three hours. Not editorial picks — pattern recognition on cold data.
Wireless Headphones
Mechanical Keyboard
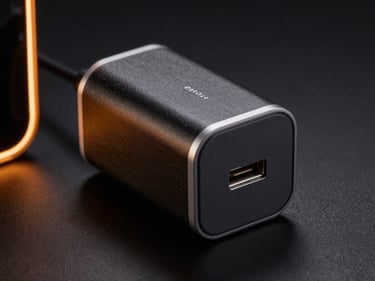
USB-C Power Bank
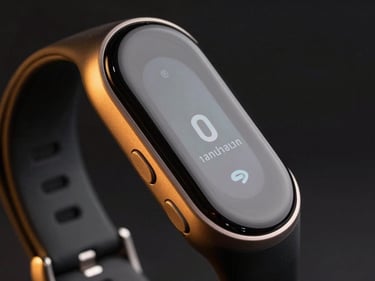
Fitness Tracker
Price cut confirmed across four retailers simultaneously. Historical data shows this pattern precedes a rebound.
Was $89 last week. Now $54. Chart shows a flash-sale pattern repeating for the third time.
Held at $120 for six weeks. Dropped to $71 today. Velocity spike started at 9 AM eastern.
Lowest price in 90 days. Three retailers competing; the chart shows the spread narrowing fast.
Three steps. Zero friction.
Paste the product link
Read the full price history
Buy now or wait for the dip
Any URL from major e-commerce retailers. We pull the product ID and start the data fetch immediately — no account, no form.
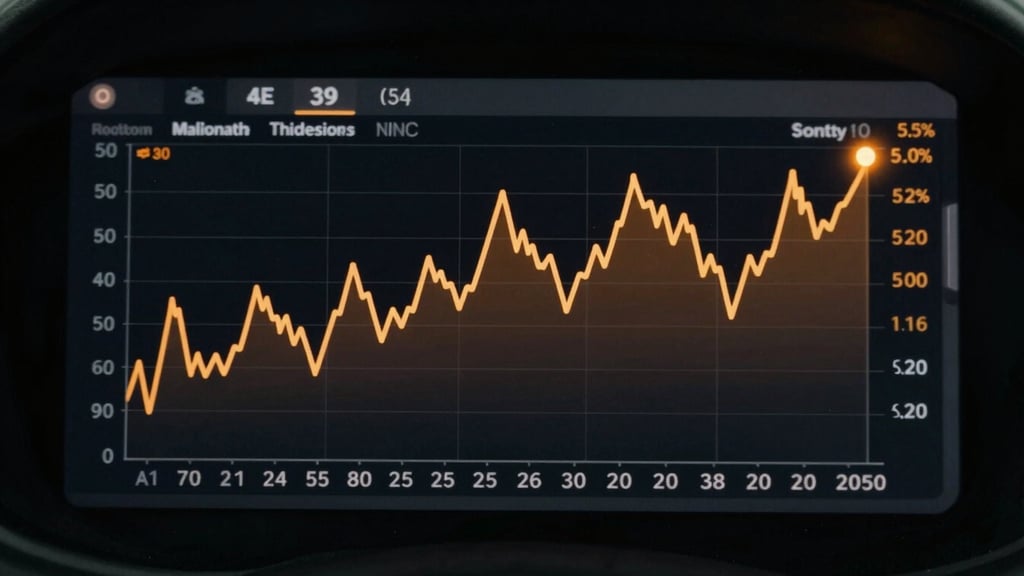
90-day chart, retailer spread, and velocity signal — all on one screen. The amber marker shows where the price stands right now.
The chart tells you whether today's price is a floor or a ceiling. Make the call with data, not a gut feeling.
The price moved while you were deciding.
Data updates every two minutes. Paste your link now and see where the number actually stands.